RK-model:
Simulation of mixture formation and combustion in diesel
Simulation method of RK-model was developed by Prof.
Razleytsev in 1990-1994. After this method was modified and complemented by Dr. Kuleshov
[1, 2, 3].
RK-model takes into account:
- - shape of the injection profile including split injection;
- - drop sizes;
- - direction of sprays in the combustion chamber;
- - dynamic of evolution of fuel sprays;
- - dynamic of swirl;
- - interaction of sprays with an air swirl and walls.
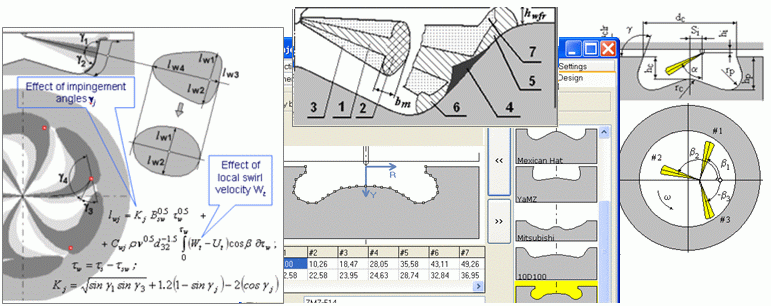
The method takes into account conditions of evolution of
each fuel spray and wall surface flows generated by sprays, and also interaction between
wall surface flows. RK-model allows determination the emission of soot and emission of NO
depending on mixture formation and combustion conditions. The software makes it possible
to find the optimum of piston bowl shape, fuel sprays directions, diameters and numbers of
nozzles, intensity of air swirl and the injection profile shape.
Main principles of RK-model are similar with Hiroyasu
combustion model, though there are considerable differences. The RK-model provides more
detailed modeling of:
- fuel sprays and walls interaction,
- interaction of near wall flows formed by sprays among themselves.
More detailed comparison of Hiroyasu and RK-model is presented
in page >>.
At simulation, the assumption is made that the heat
release process consists of four main phases. They differ by physical and chemical
peculiarities and factors limiting the rate of the process:
- Induction period.
- Premixed combustion phase.
- Mixing-controlled combustion phase.
- Late combustion phase after the ending of fuel injection.
Distribution of fuel in a diesel spray
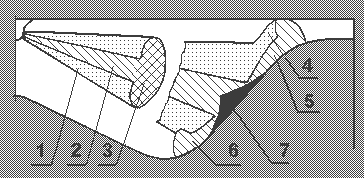 |
Notations:
1 - Dilute outer sleeve of a spray.
2 - Dense axial core of free spray.
3 - Dense forward front.
4 - Dilute outer surrounding of a near wall flow (NWF).
5 - Dense core of a NWS on a piston bowl surface.
6 - Forward front of a NWF.
7 - Axial conical core of a NWF.
|
Fig.1.
Diagram of a diesel spray.
Evolution of a free spray consists of two
main phases:
- Initial phase of pulsing evolution.
- Basic phase of cumulative evolution.
See details in...
Amount of fuel getting in the
characteristic zones with different conditions of evaporation and burning are calculated
during movement of sprays. In a list of these zones, except listed above, zones on a
piston crown, on a cylinder liner and on a cylinder head are included.
Trajectories of free sprays and movement of
near wall
flows formed by sprays are calculated in view of influence of tangential air swirl and
angle of clash between spray and wall. The intensity of an air swirl is set by swirl ratio
Rs (or swirl number). Rs is a relation between swirl angular velocity ws (in the combustion chamber at the end of
compression) and crank rotation velocity wc:
Rs = ws /
wc.
Example: Calculation of fuel sprays evolution in combustion chamber of tractor
diesel CMD
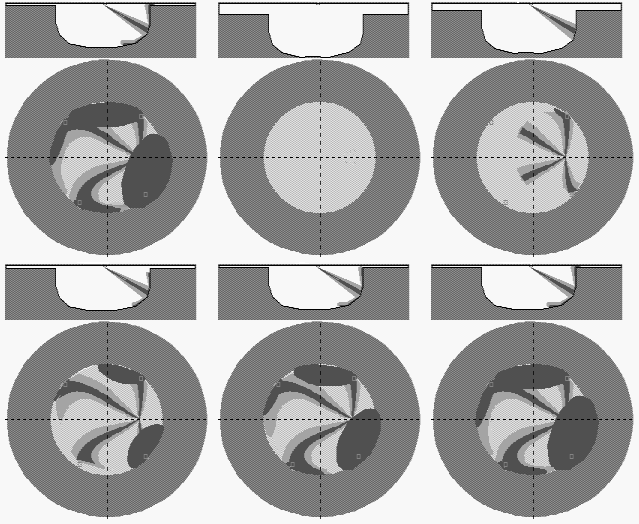
Result of fuel sprays evolution
simulation
|
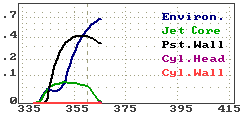
Allocation of fuel in the zones
(spray #1)
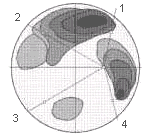
Film-gramme of wall surface flows evolution |
Notations:
Environ. - Fuel fraction allocated in
the dilute outer sleeve of free spray and in the dilute outer surrounding
of NWF.
Jet.Core - Fuel fraction allocated in dense
core of free spray.
Pst.Wall - Fuel fraction allocated in NWF.
Cyl.Head - Fuel fraction settled on cylinder
head surface.
Cyl.Wall - Fuel fraction settled on cylinder
liner surface. |
Fig. 2. Results of simulation of mixture formation in tractor
diesel CMD (rpm=1800, BMEP=7.7 Bar).
The given example presents the comparison between the
result of calculation of fuel sprays evolution and NWF movement with the experimental
film-gramme of NWF in the combustion chamber of a tractor diesel CMD (rpm=1800, BMEP=7.7
Bar). The experimental data are obtained of GSKBD (Ukraine). The intensity of air swirl in
the combustion chamber at the TDC corresponds to swirl ratio Rs=3.15. On the
diagrams it is shown how much fuel in each moment of time has got to the characteristic
zones.
Evaporation of sprayed fuel in volume and on a combustion chamber
walls
During injection of fuel and evolution of fuel sprays the rate
of combustion is limited mainly by the rate of evaporation. While spray is free the
forward front and the dilute outer surrounding of a spray are zones of intensive heat exchange and
evaporation of sprayed fuel. In high-speed and dense axial flow core the warming is low
and evaporation of drops are insignificant.
At clash of spray with a wall, the evaporation rate of fuel
accumulated in forward front is reduced sharply to a minimum at the moment of end of
stacking of front on a wall. It is caused by the lower (in comparison with gas)
temperature of a wall, reduction of blow of drops, condensation of drops-gas mixture on a
wall, merge and interfusion of vanguard drops with more cold drops flying up to a wall.
After stacking of front on a wall the biphase mixture begins to be distributed on a wall
outside the limits of a cone of spray. The evaporation rate of fuel in a wall surface zone
is increased, though remains smaller than in the volume of the chamber. When the fuel is
distributed on the surface of the piston a part of fuel can penetrate into a clearance
between the piston crown and a head of the cylinder. Fuel get on the head and on a
cylinder liner.
The evaporation rate of fuel arriving in each zone of intensive
heat exchange is equal to a sum of evaporation rates of separate drops. The evaporation of
each drop before and after ignition of fuel is simulated by the Sreznevsky's equation.
The fuel equipment of boosted diesels provides rather uniform similar atomizing of fuel,
especially on the basic phase of injection. Therefore, the calculation of evaporation of
fuel can be carried out on a base of an average Sauter drop diameter d32.
Constants of evaporation of fuel in various zones are
determined with the purpose of calculation of evaporation rate. The estimation of
constants is made by known equation in which are entered:
- Nusselt's criterion for process of diffusion;
- Factor of a diffusion for fuel vapors;
- Pressure of saturated steams;
- Density of liquid fuel;
- Characteristic pressure and temperatures including temperatures of walls.
Combustion of sprayed fuel
After termination of induction period en explosive
distribution of a flame on an activated mixture in an environment of sprays occurs. The
value of the first maximum of heat release rate curve depends on the following factors:
- the amount of fuel evaporated in the induction period;
- degree of vapor activation;
- the relation between evaporation rate during flare and mass of injected fuel;
- quality of fuel atomizing and distribution;
- time of evaporation;
- physical, chemical, thermodynamic and gasdynamic characteristics of a fuel-air mixture.
After initial flare and combustion of fuel vapours have formed
in the induction period, the heat release rate is determined, in general by rates of
evaporation and burning out of the products of incomplete combustion in volume of
cylinder. The latter depends on the average concentration of unused oxygen in volume.
In the period of late combustion phase, after termination of
injection and termination of sprays evolution, decrease of combustion rate occurs. It is
connected with reduction of weight of unburned fuel and with a limiting role of process of
a diffusion in this period. Flame disintegrates into a lot of the centers around the local
congestion of fuel in core of spray. If the significant part of fuel is allocated on a
wall of a piston bowl, especially on the surfaces near to the head of the cylinder, in the
interval of 15-30 degrees of CA after TDC, on the curves of heat release rate one more
small peak is observed. It is connected with the indignation and destruction of
quasi-laminar wall surface layer at sharp expansion of a gas above the appropriate
surface.
Example: Calculation of heat release rate in a tractor diesel CMD.
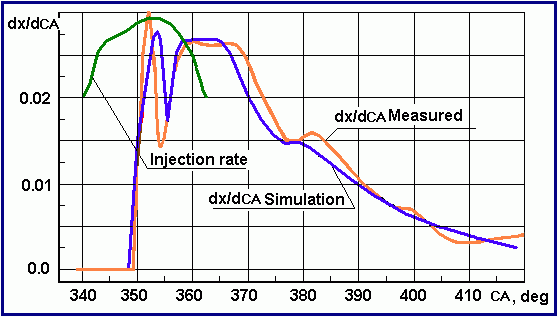
Fig. 3. Comparison of calculated and experimental curves of heat release rate dx/dCA.
(rpm=1800, BMEP=7.7 Bar.)
The submitted technique provides carrying out the
calculation of combustion in engines both with the volumetric and with the film mixing
processes.
Example:
Calculation of mixture formation and combustion in
the medium-speed marine diesel engine at full load.
Visualization of mixture formation
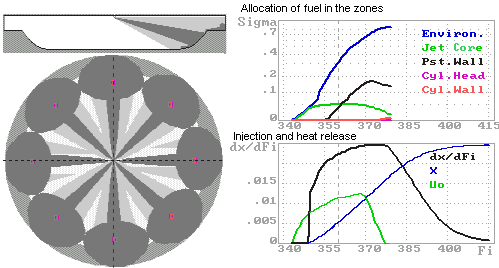 |
Notations:
Environ. - Fuel fraction allocated in
the dilute outer sleeve of free spray and in the surrounding of NWF.
Jet.Core - Fuel fraction allocated in dense
core of free spray.
Pst.Wall - Fuel fraction allocated in NWF.
Cyl.Head - Fuel fraction settled on cylinder
head surface.
Cyl.Wall - Fuel fraction settled on cylinder
liner surface. |
Example: Calculation of mixture formation and combustion in the high-speed
automobile diesel engine.
| Visualization of mixture formation
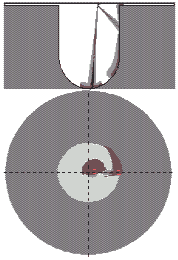 |
Spray #1 (short)
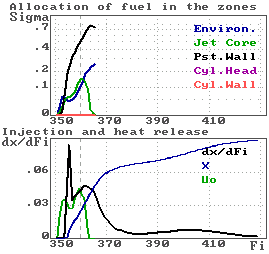 |
Notations:
Environ. - Fuel fraction allocated in
dilute outer sleeve of free spray and in the surrounding of NWF.
Jet.Core - Fuel fraction allocated in dense
core of free spray.
Pst.Wall - Fuel fraction allocated in NWF.
Cyl.Head - Fuel fraction settled on cylinder
head surface.
Cyl.Wall - Fuel fraction settled on cylinder
liner surface. |
Results of simulation of mixture formation and
combustion in different diesels at different operating modes are presented in following
pages:
All calculations are carried out with identical empiric coefficients.
REFERENCE
1.
A.S.
Kuleshov : ”Model for predicting air-fuel mixing,
combustion and emissions in DI diesel engines over whole operating range”, SAE
Paper No. 2005-01-2119, 2005.
2. A.S. Kuleshov: "Use of Multi-Zone DI
Diesel Spray Combustion Model for Simulation and Optimization of Performance and
Emissions of Engines with Multiple Injection", SAE Paper No 2006-01-1385, 2006.
3. A.S. Kuleshov: "Multi-Zone DI Diesel
Spray Combustion Model and its application for Matching the Injector Design with
Piston Bowl Shape", SAE Paper No 2007-01-1908, 2007.
Return to page "Calculation
models"


|
