Common Rail controlling algorithm development
Fuel injection systems with microprocessor
controlling make it possible to reduce an air pollution emission of diesel engine.
However, development of controlling algorithm for these systems is a problem which
requires a large expenditure. The development of first approach of this algorithm by means
of computer simulation and optimization is the issue of the day. Sequence of actions and
some results of research in this direction performed in Bauman Moscow State Technical
University are presented below.
Step: 1.
Calibration of calculation model for
high-speed diesel in 10…11 points of operating range.
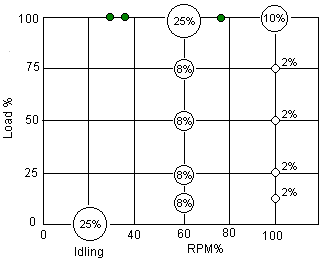
| Fig. 1. |
Diesel operating range. % inside a ring means a contribution of the point
in overall emission level. Green points was add to increase accuracy on external curve. |
In each marked point of operating range the injection
profiles of Bosch VE was calculated with INJECT software intended for fuel injection
system simulation. These injection profiles were included into data file of DIESEL-RK
software. In the each marked point diesel was calculated with DIESEL-RK and results were
compared with experimental ones. There were compared:
- Power [kW] and SFC [g/kW h],
- Maximum cylinder pressure p_max [bar],
- Air flow rate [kg/sec],
- NO emission [ppm],
- Smoke emission [Hartridge].
DIESEL-RK was calibrated
to achieve high accuracy of high-speed engine simulation over the whole operating range
with identical coefficients. Results of simulation and comparision calculated data with
experimental ones are presented in fig. 2.
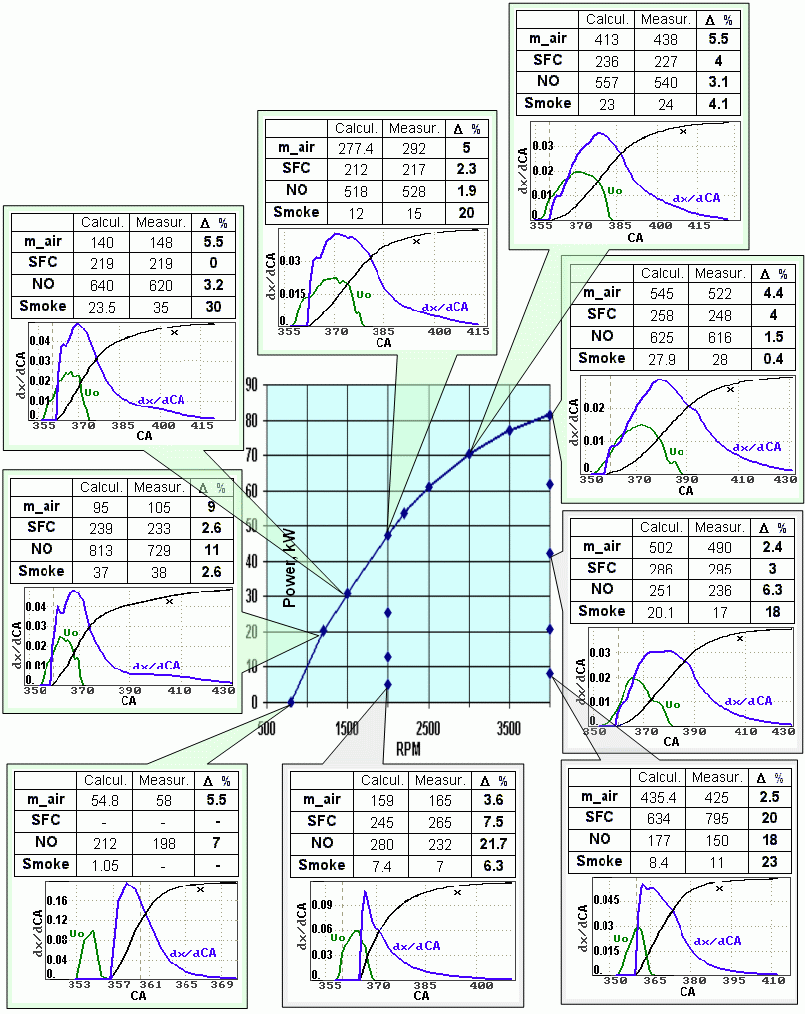
| Fig. 2. |
Results of simulation of high speed diesel over whole operating range and
comparision of calculated data with experimental ones.
m_air is an air flow rate, kg/s;
SFC, g/kW h; NO, ppm,
Smoke is a Smoke Bosch Number. |
Step:
2.
Modeling of Common Rail injection profiles
with
INJECT software. In the 9 points of operating map the CR injection
profiles were calculated to obtain individual sections of injection profile beginning and
ending. These sites are marked by rectangles in figure 3. Lately, at optimization of
injection duration on each operating mode, optimized injection profile includes these
sites connected with line. Thus injection duration is alone factor, which describes
injection profile on current operating mode (injection velocity curve is calculated as a
function of cycle fuel mass, injection duration and shape of injection profile). Actual
injection profile has a same shape but scaled to provide fixed cycle fuel mass and
specified injection duration.
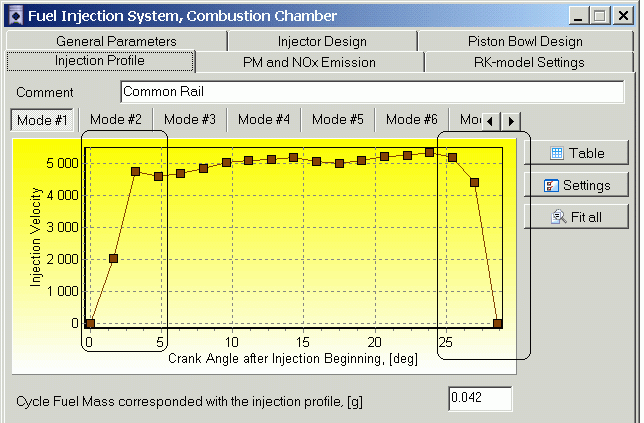
| Fig. 3. |
Injection profile of CR system. Marked sites are calculated for each
operating point with especial software. |
Step:
3.
Optimization of Injection Duration
fi and Injection Timing qi to decrease both NO and smoke emission. In 9
points of operating map there were performed optimizations by 2D scan method. Goal of
optimization is finding of fi and qi combination provided minimum of sum emission
SE. The points where optimization was carried out are marked by orange in diagrams of
operating maps (fig. 4, 5, 6).
Complex of air pollutant: Summary Emission (SE) of PM
and NOx calculated as:
SE = Cpm (PM / 0.15) + Cno (NOx / 7.);
where: PM is a specific particulate matter emission,
NOx is a
specific nitrogen oxides emission,
Cpm is an
empiric line factor for Particulate Matter emission (0.5);
Cno is an
empiric line factor for Nitrogen Oxides emission (1.0).
The coefficients: Cpm and Cno have to be calibrated for each type of
engine.
In each of 9 operating points the 2D map of scanning
results were obtained with using DIESEL-RK software. Taking into account limitations
(restrictions) p_max < 130 bar; p_inj max < 1650 bar, optimum
values of fi and qi were founded to achieve minimum level of SE.
Results are presented in fig. 4. Allowable area is yellow filled; optimal area with
minimum emission level is blue-green filled. Selected point for controlling algorithm
forming is marked with black rhomb.
At full load (fig. 4. pic. 1) the allowable area is not
crossing with optimal area. On other operating points (fig. 4, pics. 2-6) there are common
sites of allowable area and optimal area. Thus, the results point at full load has to be
selected as a near to optimal area.
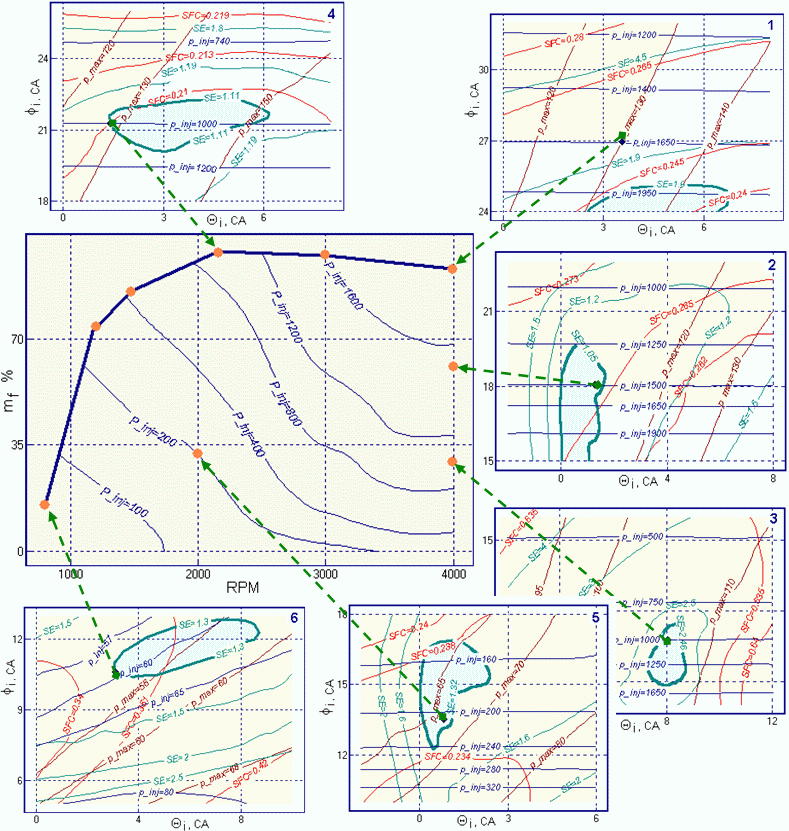
| Fig. 4. |
Results of Injection pressure 2D approximation over whole operating range
on a base of emission level optimization performed in each point in view of limitations (p_max
< 130 bar; p_inj max < 1650 bar).
fi is
Injection Duration [CA]; qi
is
Injection Timing [CA before TDC].
Allowable area is yellow filled; optimal area with minimum emission level is
blue-green filled. Selected point for controlling algorithm forming is marked with black
rhomb. Injection pressure p_inj is a pressure before nuzzles. Accumulator pressure is more
due to losses in cone. One may be calculated with software for fuel injection simulation. |
Enlarge 2D scanning results pictures...and
explain them.
Step:
4.
Common Rail controlling parameters maps forming.
Parameters of fuel injection corresponding with minimal summary emission or minimal SFC,
(if strongly marked minimum of SE was not founded), were get into operating map (fig. 4.).
In fig. 4 only six 2D scanning maps are presented.
Actually in every orange point 2D scanning was performed and results of optimization were
got into operating maps.
After, the obtained Injection Pressure p_inj,
optimal Injection Duration fi and optimal
Injection Timing qi were approximated
in whole operating map as functions of RPM and fuel mass (mf ).
Results of approximation are presented in figure 5.
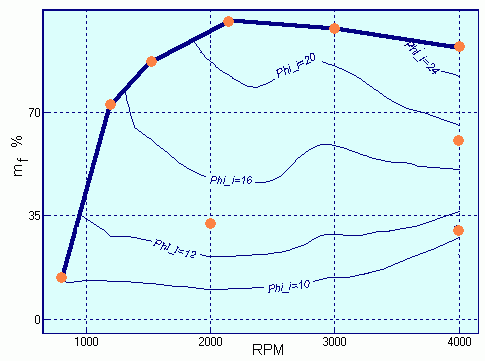
a) Optimal Injection Duration fi
as a function of RPM and fuel mass.
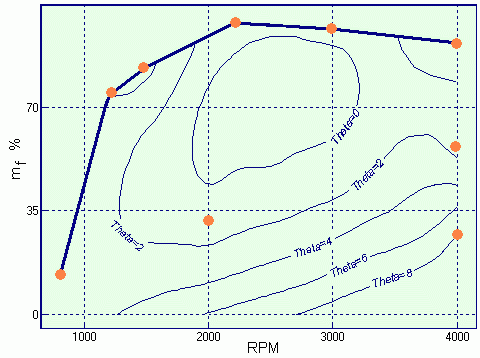
b) Optimal
Injection Timing qi as a
function of RPM and fuel mass.
| Fig. 5. |
Injection duration fi and
injection timing qi as functions of RPM and
fuel mass per cycle mf. Results of 2D approximation. |
Obtained character of controlling algorithm maps is
available for only achieving minimum of air pollution. If other goal will be formulated,
for example to achieve minimum of SFC, the maps of injection parameters will be different
because minimum of SE disagrees with minimum of SFC in map with axis: fi and qi.
Step:
5.
Comparison of emission levels of engine
with obtained controlling algorithm on the one hand and of engine with base configuration
on the other hand is presented in table below. Emission levels were calculated for both
engine configurations with using of contributions of each operating mode presented in
fig.1. Base engine parameters are accepted as 100%.
| Engine configuration |
NO |
PM |
| Base: Bosch VE |
100% |
100% |
| Common Rail with developed algorithm |
88% |
46% |
Conclusion
- The designed technique of computational making of base control algorithm for Common Rail
allows decrease expenditure on development of diesel control system .
- The number of points where optimization was carried out (9) is not sufficient for
correct and smooth approximation. It seems, that the amount of points should be enlarged
up to 12...13.
- Computational making of optimal controlling algorithm for main fuel injection parameters
with DIESEL-RK software allows resolving the problems of decrease NO and PM emissions in
diesel.
To page "Applications"


|
